Service Taxonomies and Platform Level Metrics
It is today easier than ever to generate a lot observability data (metrics, logs and traces) from your applications and forward it to a central location where you can efficiently query it. However, systems can still get pretty hard to reason about. Having an abundance of application specific data generated from your system does not guarantee that an on-call engineer or operator will know what queries will yield meaningful insight into the current system state.
This is why frameworks like Google’s “Four Golden Signals” or Weaveworks’ RED method were created: to reduce the cognitive load of humans trying to understand systems they are not closely familiar with. The RED method, for example, prescribes three high-level signals which should be observed for each application: Request Rate, Error Rate, and Request Duration. This is a great idea, which I like very much, but it does fall short as noted by author Tom Wilkie:
“It is fair to say this method only works for request-driven services - it breaks down for batch-oriented or streaming services for instance. It is also not all-encompassing.”
In this article, I want to present two ideas we came up with at Nexar (where I work) which when merged might be used to create flexible frameworks which can cover any kind of service: the service taxonomy and platform level metrics (PLMs).
The service taxonomy
Taxonomies are systematic classifications of things. Grouping things into distinct classes helps us look at their commonalities in abstract instead of on an individual basis. When developing software, the abstractions we choose can make or break a system. Choose an abstraction too coarse and each interaction with it requires a work to peek underneath the hood to get anything useful done; choose an abstraction too fine, and you’re stuck with a system that’s inflexible, hard to test and evolve. But a good abstraction is magical: at once your system seems simple, component boundaries just fall into place; the important stuff is crystal clear and the gory implementation details are confined to their place. Having a good classification of the services in your company really reduces the cognitive load required to reason about it.
When examining our systems at Nexar, we see four patterns of server side services emerge:
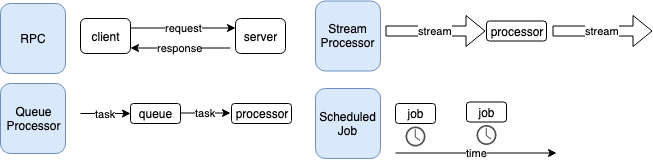
The Nexar service-type taxonomy. Source: Nexar Platform Engineering Guidelines
- RPC Servers are used when synchronous, request-response pattern is required. Meaning a client makes a call, keeps a network connection alive and waits for a response from the server.
- Queue Processors are used when asynchronous processing of work is more appropriate. Meaning a client requests a service to perform a unit of work at a later point in time, but does not keep a network connection open waiting for a response. In our system queue processors are usually backed by an AWS SQS queue.
- Streaming Applications are used to transform one or more streams of data into new streams of data or into a data store. In our system, these are usually Kafka Streams based applications.
- Scheduled Jobs are not initiated by a client request but instead are scheduled to run periodically, usually to generate a report, run a monitoring check or perform an ETL task. In our system, we try to do this as a Kubernetes CronJob, but it can be a Jenkins Scheduled build as well.
A common property of taxonomies is that they are hierarchical. As you can probably see, each of these service types can be further broken down into more specfiic subclasses, depending on our needs.
Having a service taxonomy is powerful. Each of the four service types we run has very distinct properties which allow thinking in abstract about a whole group of services all at once. This enables us to write and manage libraries and infrastructure dedicated to solving specific issues that arise in each problem domain. This is especially true when it comes to instrumentation and monitoring as we will soon see.
Platform Level Metrics
We can classify metrics emitted by our applications into two groups:
- Application-specific Metrics - these are signals emitted by an application which are unique to its business logic. For instance, our login service counts how many two-factor-authentication SMSs we failed to deliver, broken down by recipient country code and messaging provider.
- Platform Level Metrics - are signals which are not generated by the application business logic code but instead are instrumented at the library or infrastructure level. For example, we use Ambassador, an envoy based API gateway solution in front of our externally facing microservices; the underlying envoy infrastructure emits a ton of very detailed signals, including request count and error count broken down by backend service.
PLMs are great because they come for free, out of the box, and don’t require a developer to remember to implement them. They are uniform - no potato-potatoe issues around metric names or spelling. Having certain metrics always be collected, without deliberate action from the application developer is especially useful because when debugging application failures you’re dealing with unknown unknowns: applications usually fail in the ways we didn’t anticipate (we wrote code to deal with the scenarios we did anticipate, right?).
Having a wide range of signals collected by default can help you answer questions you didn’t even think you would want to ask when you initially wrote your application and save you from releasing instrumentation patches hastily as you’re managing a production outage.
Service-type specific golden signals
Each service-type in our taxonomy has a unique mode of operation and therefore should have specific health signals. The RED system covers RPC services pretty well, but how about queue processors or a scheduled job? Having a set of gold signals is very useful because once we uncover what they are we can:
- Make sure our libraries and infrastructure emit these signals by default.
- Automatically generate standard dashboard and alerts, tailored to the service type
Having standard, automatically generated dashboards and alerts is the entire point of this exercise: to create a simple, small and predictable interface between things running in production and the humans that need to understand them, even without deep knowledge of their inner workings.
Here is a rough draft of gold signals, by service type:
RPC
- Request rate - how much traffic is the service dealing with, measured in queries per second. Ideally, this should be measured at the API Gateway, Service Mesh or load balancer, so we don’t lose track of requests which hit a dead or overloaded instance and returned with a 502 (Gateway timeout) error or similar.
- Error rate - how much of the incoming requests are failing, measured as a proportion of total traffic.
- Duration - how long are we taking to process each request, measured as a percentile on a histogram, usually the 99th. For example, the p99 latency of our Login service is 948ms today. Meaning 1% of our requests took 948ms to process or more.
Queue Processor
- Lag - how much time passed between the message ingress time and when we start processing it, measured in milliseconds.
- Net queue size change - how many messages were written to the queue minus how many messages were removed from the queue in a given time frame. A positive number indicates we are not keeping up, a negative number shows we are catching up with the backlog. Measured in message count.
- Error rate - the proportion of messages we failed processing divided by the number of messages we tried to process. Measured as a percentage.
- Duration - see RPC duration signal.
Stream Processor
- Lag per partition per ingress topic - streaming applications take one or more topics as input and each topic is split into one or more partition. Our application’s consumer group will be at a certain offset on each of these partitions. We sample the current max offset on each partition and subtract our current position in each one, the sum of all differences gives us the total lag. Measured in message count.
- Errors - see queue processor error rate.
- Throughput - a sum of how many egress records our application emits in a given timeframe, this could be into a target data store or topic. Many streaming applications perform a reduction operation (aggregate many events into few) so it isn’t necessarily expected to be on the same order of magnitude as the application ingress.
Scheduled Job
- Failed invocations - a count of how many jobs failed to run to completion.
- Missed Executions - by nature, scheduled jobs depend on a scheduler be available to invoke them, therefore we monitor for missed executions by comparing the expected execution times (dictated by the cron expression we set for a given job) and actual invocation attempts.
- Duration - see other duration signals.
Collecting Platform Level Metrics in Practice
Some of the signals listed above are quite trivial to collect, some will require engineering effort to make available. In general, there are three types of collection strategies:
- Raw metrics exported by infrastructure - whether the infrastructure is operated by our cloud provider or internally, modern infrastructure components export a variety of signals which we can ingest using our monitoring system of choice. This is the best kind of signal because it will work across the board regardless of what programming language we choose. Examples: by running all internal RPC calls through an envoy based service mesh, you can get metrics, access logs, and traces out of the box; by using a cloud provider’s queue implementation like AWS SQS you get a bunch of metrics out of the box without needing to explicitly instrument them.
- Derived metrics - sometimes the signal we want isn’t readily available in the form we need and so we must deploy a piece of software in our production environment to transform raw data into a form we can work with. This can be something like the “exporter pattern” which is common in the Prometheus world - a process that takes metrics from one form (for example JMX metrics in a java app) into a Prometheus metrics endpoint. In other cases it will require applying some more logical processing, for example, to instrument missed executions of Kubernetes CronJobs we had to write a custom app that observes Job executions and evaluates the CronJob cron expression definition. This isn’t always easy to do, but if you write code that you can leverage for many services of the same type then it’s an effort well spent.
- Metrics exported by libraries - as much as we’d like all of our core signals to be instrumented at the infrastructure layer, it is at times not possible. Our next best choice is to instrument at the library layer. For instance, at Nexar, we have a
SimpleQueueListenerJava class that encapsulates all queue handling logic: all the application needs to supply is a function that processes a message and returns a Status (OK,TRANSIENT_ERROR,PERMANENT_FAIL) and the Queue Listener class handles all the plumbing. The returned status code determines whether the message will be returned to the queue or deleted and whether it will be instrumented as a successful invocation or not. The reason we instrument at the library layer is that we can’t get the granularity we need at the infrastructure layer. The risk here is that the implementation is language-specific and should we want to implement a Queue Processor using a different language we will have to be very careful to implement the same instrumentation code once again. Even a small discrepancy in spelling will render our automatically generated dashboards useless.
Wrapping Up
- Having simple, consistent metrics describe all our services in production greatly simplifies cognitive load for engineers and operators interacting with services in production.
- Google’s four golden signals or the RED method are a great start, but they address mostly RPC style services.
- By trying to classify our services into a service taxonomy, we find four patterns of services emerge: RPC, Queue Processor, Stream Processor, and Scheduled Job.
- We are able to match a fine-tuned version of “golden signals” to each service type.
- By formally defining the golden signals to each service, we can make sure these signals are instrumented and exported to our metric collection system without deliberate action from an application developer.
- On top of these platform-level metrics, we can automatically generate simple, consistent dashboards and alerts across to create systems that are easier and more fun to operate.